This is a legacy product. Please contact us for the latest version.sales@ocaire.com, MFLD BLOCK ASSY, VALVE, VV5Q51/55 NO SIZE RATING, 1.43300 lb
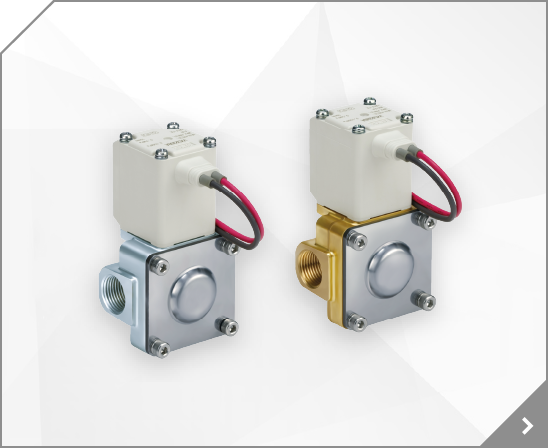
VALVE, SOL, 4/5 PORT SOLENOID VALVE, VVD, 1.00000 lb
SMC has improved product performance and reliability with the redesigned SY series valve. The SY3000 and SY5000 have the same valve width as their predecessors, but the flow has been increased by up to 80%, allowing the valve size to be reduced. A built-in strainer in the pilot valve prevents trouble caused by foreign matter. By using H-NBR seal material for the main valve and seals, Ozone
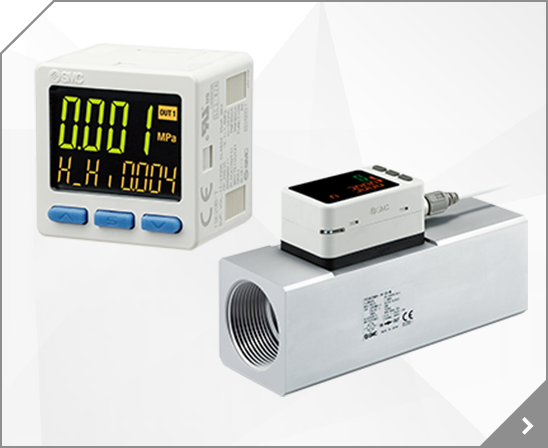
DIGITAL FLOW SWITCH, DIGITAL FLOW SWITCH, WATER, PF3W, F19, 320 lb
SMC has improved product performance and reliability with the redesigned SY series valve. The SY3000 and SY5000 have the same valve width as their predecessors, but the flow has been increased by up to 80%, allowing the valve size to be reduced. A built-in strainer in the pilot valve prevents trouble caused by foreign matter. By using H-NBR seal material for the main valve and seals, Ozone
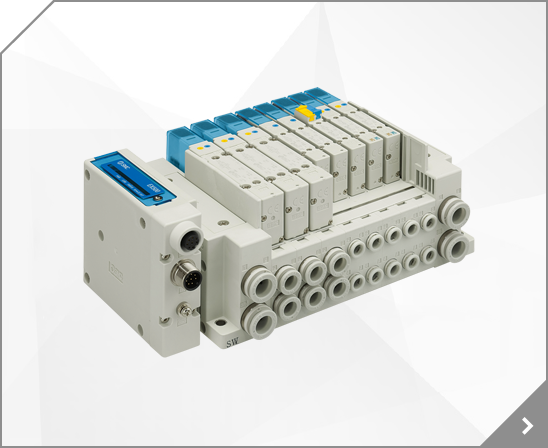
Series SY offers major advances in valve performance for cost-effective solutions to your requirements. The series offers high flow with low power consumption in a compact design. The SY is available in body ported or base mounted styles and can be used individually or manifold mounted.Fluid: air , Operating pressure range: (internal pilot) 0.1 - 0.7MPa (external pilot) -100kPa to 0.7MPa
This is a legacy product. Please contact us for the latest version.sales@ocaire.com, VALVE, SOL, VALVE, SY5000 SOL/VALVE, RUBBER SEAL, PG, SY5000 BASE MT 1/4, 0.05511 lb
SMC has improved product performance and reliability with the redesigned SY series valve. The SY3000 and SY5000 have the same valve width as their predecessors, but the flow has been increased by up to 80%, allowing the valve size to be reduced. A built-in strainer in the pilot valve prevents trouble caused by foreign matter. By using H-NBR seal material for the main valve and seals, Ozone
SMC has improved product performance and reliability with the redesigned SY series valve. The SY3000 and SY5000 have the same valve width as their predecessors, but the flow has been increased by up to 80%, allowing the valve size to be reduced. A built-in strainer in the pilot valve prevents trouble caused by foreign matter. By using H-NBR seal material for the main valve and seals, Ozone
Series SY offers major advances in valve performance for cost-effective solutions to your requirements. The series offers high flow with low power consumption in a compact design. The SY is available in body ported or base mounted styles and can be used individually or manifold mounted.Fluid: air , Operating pressure range: (internal pilot) 0.1 - 0.7MPa (external pilot) -100kPa to 0.7MPa
Series SY offers major advances in valve performance for cost-effective solutions to your requirements. The series offers high flow with low power consumption in a compact design. The SY is available in body ported or base mounted styles and can be used individually or manifold mounted.Fluid: air , Operating pressure range: (internal pilot) 0.1 - 0.7MPa (external pilot) -100kPa to 0.7MPa
VALVE, SOL, 4/5 PORT SOLENOID VALVE
SMC has improved product performance and reliability with the redesigned SY series valve. The SY3000 and SY5000 have the same valve width as their predecessors, but the flow has been increased by up to 80%, allowing the valve size to be reduced. A built-in strainer in the pilot valve prevents trouble caused by foreign matter. By using H-NBR seal material for the main valve and seals, Ozone
SMC has improved product performance and reliability with the redesigned SY series valve. The SY3000 and SY5000 have the same valve width as their predecessors, but the flow has been increased by up to 80%, allowing the valve size to be reduced. A built-in strainer in the pilot valve prevents trouble caused by foreign matter. By using H-NBR seal material for the main valve and seals, Ozone
VALVE, SOL, 4/5 PORT SOLENOID VALVE, VVD, 100.00000 lb
This is a legacy product. Please contact us for the latest version.sales@ocaire.com
This is a legacy product. Please contact us for the latest version.sales@ocaire.com, RETRACTABLE PIN PACKAGE, ACTUATOR, LSA CYL, LOCATING PIN, QC, 75MM LSA CYL, LOCATING PIN, .00000 lb
This is a legacy product. Please contact us for the latest version.sales@ocaire.com, VALVE, SOL, VALVE, SY7000 SOL/VALVE, RUBBER SEAL, PG, SY7000 BASE MT 1/4, 4.91189 lb
This is a legacy product. Please contact us for the latest version.sales@ocaire.com, VALVE, SOL, VALVE, SY7000 SOL/VALVE, RUBBER SEAL, WD, SY7000 BUILT IN FITTING >1/4
